Initially, for pure success probabilities I wouldn't add time to the equation. In the steady-state we just work with basic probability multiplications. If the probabilities of success rates remain independent of each other, then they form a pattern. Say we have three tries for relief wells, each one having a value between 0 and 1. If all three fail then the whole attempt failed:
P(failure) = P1(failure)*P2(failure)*P3(failure)and
P(success)=1-P(failure)so if P1=P2=P3=1-0.7=0.3
then P(failure)=0.027
and P(success)=0.973
Apart from end-state failure analysis, you can also do a time-averaged effectiveness, where the rates help you do a trade-off analysis between how long it takes before you fix the problem and how much oil gets released in the meantime. Unfortunately, when you look at the optimization criteria, the only valid optimum in most people's minds is to stop the oil leak as quickly as possible. Otherwise it looks like we play dictator rolling dice (at least IMO that is the political response I predict to get).
Given that political issue, you can create a set of criteria with weights on the probabilities of success, the cost, and on the amount of oil leaked (the first and third as Markov models as a function of time). When you combine the three and look for an optimum, you might get a result that gives you a number of relief wells somewhere between 1 and infinity. The hard part remains establishing the weighting criteria. Place a lower weight on cost and you will definitely lower the number of wells. And that's where the politics plays in again, as many people will suggest that cost does not form a limitation. We also have the possibility of a massive blow-out by adding a botched relief well, but that risk may turn out acceptable.Below I show a state diagram from a Markov-based reliability model. With the Markov process premise you can specify rates of probability flow between various states and then execute it without having to resort to Monte Carlo.
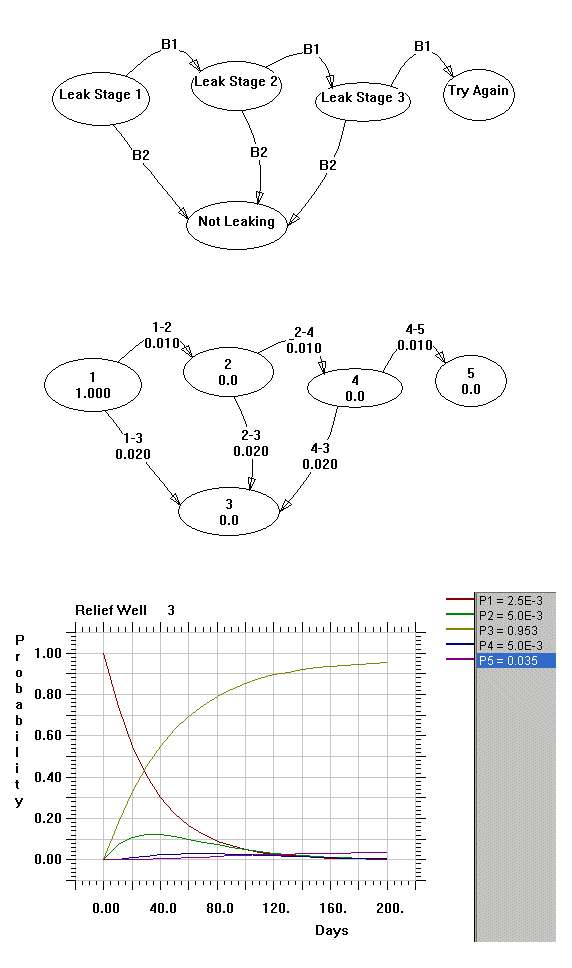
I made this diagram for 3 relief wells drilled in succession, when one doesn't work, then we start the next. The term B1 is the rate for a failure specified as 0.01 (or 1 in 100 days). B2 is a success rate of 0.02 (or 1 in 50 days). The start state is P1, the success state is P3, and the end failure state is P5.
When I execute this for 200 days, the probability of entering state P5 is 3.5% and it will rise to 3.7% after 1000 days. P3 is 95% after 200 days. The sanity check on this gives a success ratio of about 0.02/(0.01+0.02)=0.666 and from the formula this gives a probability of failure at the end state of (1/3)^3 = 0.037 = 3.7%. This sanity checks with the output after 1000 days.The Markov model allows you to predict the time dependence of success and failure based on the assumptions of the individual non-redundant failure rates. You can thus work the model as a straightforward reliability prediction. Change the success probabilities to 50% individual success rate and we still only need three relief wells if we want to get to 87.5% . Contrast that to 97% average success rate with 3 wells, if we remain on the optimistic side of 50%. So you can see that our confidence grows with the confidence in the success of the individual wells, which makes intuitive sense.

As another possibility, we can repeat an individual relief well several times, backing up and retrying if the last one doesn't work. That models as a state that directs back on itself, with a rate B4. I won't run this one because I don't know the rates of retries, but the general shape of the of the failure/success curve looks similar.
I'm sure some group of analysts somewhere has worked a similar kind of calculation. Whether it pays off or not for a single case, I can't really say. However, this kind of model effectively describes how the probabilities work out and how you can use a state diagram to keep track of failure and success transitions.
By the way, this same math goes into the Oil Shock Model which I use for oil production prediction. In the oil shock model, transitions describe the rates between oil production life-cycle states, such as construction and maturation and extraction. So both the reliability model and the Oil Shock model derive from probability-based data flow models. This kind of model works very well for oil production because we have a huge number of independently producing regions around the world and the law of large numbers makes the probability projections that much more accurate. As a result, I would put more trust in relying on the results of the oil shock model than predicting the success of the recovery of a single failed deep-water production well. Yet, the relief well redundancy model does help to estimate how many extra relief wells to add and adds some quantitative confidence to one's intuition.Based on the post by Joules Burn (JB) on TOD BP's Deepwater Oil Spill: A Statistical Analysis of How Many Relief Wells Are Needed, I added a few comments:
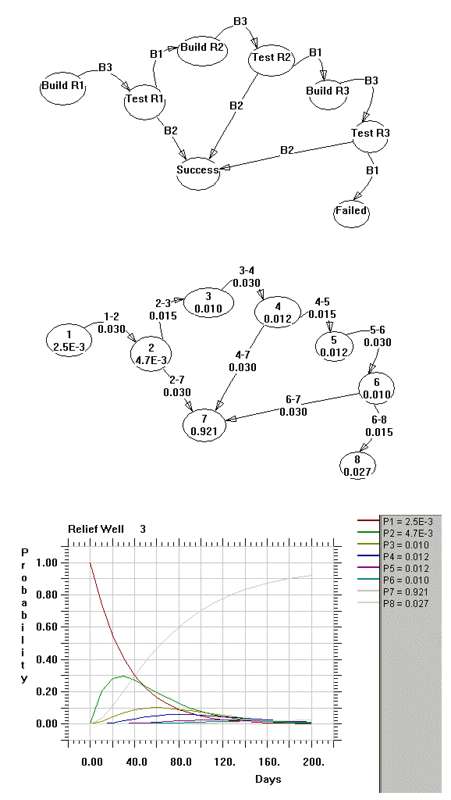
JB did everything perfectly correctly given the premises. Another way to look at it is that you need to accomplish a sequence of steps, each with a probability rate of entering into the next state. This would simulate the construction of the relief well itself (a sequence of steps). Then you would have a rate into a state where you start testing the well for success. This goes into a state that results in either a success, retry, or failure (the utter failure in JB lingo). The convenient thing is that you can draw the retry as a feedback loop, so the result looks like the following for a single well:

I picked some of the numbers from intuition, but the results have the general shape that JB showed. When you look at a rate like 0.1, inverting it gives a mean transition of 10 days.
This is a state diagram simulation like that used in the Oil Shock model, which I use to project worldwide oil production. I find it interesting to see how well accepted the failure rate approach is for failure analysis, but few seem to accept it for oil depletion analysis. I presume oil depletion is not as mission critical a problem as the Gulf spill is :)