Saturday, October 23, 2010

Understanding Recovery Factors

A recent TOD post on reserve growth by Rembrandt Kopelaar motivated this analysis.

The recovery factor indicates how much oil that one can recover from the original estimate. This has important implications for the the ultimately recovery resources, and increases in recovery rate has implications for reserve growth.

First of all, we should acknowledge that we still have uncertainty as to the amount of original oil in place, so that the recovery factor has two factors of uncertainty.

The cumulative distribution of reservoir recovery factor typically looks like the following S-shaped curve. The fastest upslope indicates the region closest to the average recovery factor.

Figure 1: Recovery Factor cumulative distribution function (from)

To understand the spread in the recovery factors, one has to first realize that all reservoirs have different characteristics. Some are more difficult to extract from and others have easier recovery factors. One of the principle first-order effects has to do with the size of the reservoir: bigger reservoirs typically have better recovery factors and as one reservoir engineer mentioned on TOD
"Reserve growth tends to happen in bigger fields because thats where you get the most bang for your buck"
So if we make the simple assumption that cumulative recovery factors (RF) have Maximum Entropy uncertainty or dispersion for a given Size:
P(RF) = 1-exp (-k*RF/Size)
this makes sense as the recovery factor will extend for larger fields.

Add to the mix that reservoir Sizes go approximately as (see here):
Pr(Size)= 1/(1+Median/Size)
Then a simple reduction in these sets of equations (with the key insight that RF ranges between 0 and 1, i.e. between 0 and 100%) gives us
P(RF) = 1 - exp(-k*RF*RF/(1-RF)/Median)
the ratio Median/k indicates the fractional average recovery factor relative to the median field size.

A set of curves for various k/Median values below:


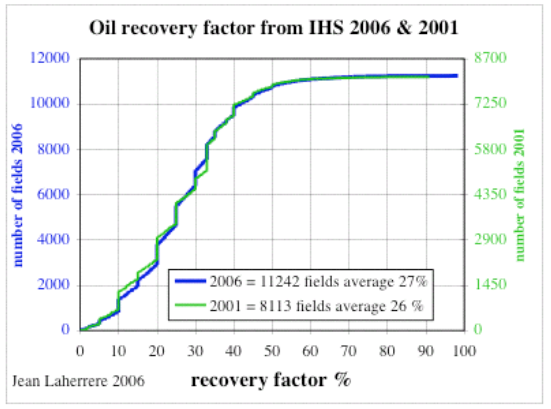
Figure 2: Recovery Factor distribution functions assuming maximum entropy

Rembrandt provided some recovery factor curves originally supplied by Laherrere, and I fit these to the Median/k fractions below.

Figure 3: Recovery factor curves from Rembrandt's TOD post,
alongside the recovery factor model described here.

Laherrere also provided curves for natural gas, where recovery factors turn out much higher.

Figure 4: Recovery Factor distribution functions for natural gas.
Note that the recovery factor is much higher than for oil.
(Note: I had to fix the typo in the graph x-axis naming)

It looks like this derivation has strong universality underlying it. This remains a very simple and parsimonious model as it has only one sliding parameter. The parameter Median/k works in a scale-free fashion because both numerator and denominator have dimensions of size. This means that one can't muck with it that much -- as recovery factors increase, the underlying uncertainty will remain and the curves in Figure 2 will simply slide to the right over time while adjusting their shape. This will essentially describe the future reserve growth we can expect; the uncertainty in the underlying recovery factors will remain and thus we should see the limitations in the smearing of the cumulative distributions.

To reverse the entropic dispersion of nature and thus to overcome the recovery factor inefficiency, we will certainly have to expend extra energy.


Wednesday, October 20, 2010

Bird Surveys

This post either points out something pretty obvious or else it reveals something of practical benefit. You can judge for now.

I briefly made a reference to bird survey statistics when I wrote this post on econophysics and income modeling. I took a typical rank histogram of bird species abundance and fit it the best I could to a dispersive growth model, further described here. The generally observed trend follows that many species exist in the middle of abundance and relatively small numbers of species exist at each end of the spectrum -- few species exceedingly common (i.e. starling) and few species exceedingly rare (i.e. whooping crane). Since the bird data comes from a large area in North America, the best fit followed a meta-community growth model. The meta-community adjustment impacts the knee of the histogram curve and broadens the Preston plot, effectively smearing over geological ages that different species have had to adapt.

Figure 1: Preston plot (top) and
rank histogram (bottom) of relative bird species abundance

If we assume that the relative species abundance has a underlying model related to steady-state growth according to p(rate), where rate is the relative advantage for species reproduction and survival, then this should transitively might apply to disturbances to growth as well. Recently, I ran into a paper that actually tried to discern some universality in diverse growth papers, and it coincidentally used the bird survey data along with two economic measures of firm size and mutual fund size.
I did the best I could with the figures in the paper but eventually went to the source, ftp://ftpext.usgs.gov/pub/er/md/laurel/BBS/DataFiles/, and used data from 1997 to 2009.

I applied the same abundance distribution as before and came up with the fit below (see blue and red curves below, data and model respectively). That provided a sanity check, but Schwarzkopf and Farmer indicated that the year-to-year relative growth fluctuations should also obey some fundamental behavior through the distribution of this metric:
RelativeGrowth(Year) = n(Year+1) / n(Year)
Sure enough, and for whatever reason, the "growth" in the surveyed data does show as much richness as the steady state averaged abundance distribution. The relative growth in terms of a fractional yearly change sits alongside the relative abundance curve below (in green). Notice right off the bat that the distribution of fractional changes drops off much more rapidly.

Figure 2 : The red meta-model curve smears the median from 200 to 60000

I believe that this has a simple explanation having to do with Poisson counting statistics. When estimating fractional yearly growth, we consider that the rarer bird species having the lowest abundance will contribute most strongly to fluctuation noise on year-to-year survey data. Values flipping from 1 to 2 will lead to 100% growth rates for example. (We have to ignore movements from 1 to 0 and 0 to 1 as these growths become infinite.

I devised a simple algorithm that takes two extreme values (R greater than 1 and R less than 1 ) and the steady state abundance N for each species. The lower bound of:
R1 = R * (1-sqrt(2/N))/(1+sqrt(2/N))
and the upper bound becomes:
R2 = R * (1+sqrt(2/N))/(1-sqrt(2/N))
The term 1.4/sqrt(N) derives from Poisson counting statistics in that the relative changes become inversely related to the size of the sample. We double count in this case because we don't know whether the direction will go up or down, relative to R, a number close to unity.

(This has much similarity to the model I just used in understanding language adoption. Small numbers of adopters experience suppressing fluctuations as 1/sqrt(N))

Expanding on the scale, the results of this algorithm are shown in Figure 3.

Figure 3 : Model of yearly growth fluctuation in terms of a cumulative distribution function

Placing it in terms of a binned probability density function, the results look like the following plot. Note the high counts match closely the data simply because the 1/sqrt(N) is relatively small. Away from these points, you can see the general trend develop even though the data is (understandably) obscured by the same counting noise.

Figure 4 : The probability density function of yearly growth fluctuations.

As an essential argument to take home, consider that a counting statistics argument probably accounts for the yearly growth fluctuations observed. Before you make any other assertions, you likely have to remove this source of noise. Looking at Figure 3 & 4, you can potentially see a slight bias toward positive growth for certain lower abundance species. This comes at the expense of lower decline elsewhere, except for some strong declines in several other low abundance species. This may indicate the natural ebb and flow of attrition and recovery in species populations, with some of these undergoing strong declines. I haven't done this but it makes sense to identify the species or sets of species associated with these fluctuations.

Two puzzling points also stick out. For one, I don't understand why Schwarzkopf and Farmer didn't immediately discern this effect. Their underlying rationale may have some of the same elements but it gets obscured by their complicated explanation. They do use a resampling technique (on 40+ years worth of data) but I didn't see much of a reference to conventional counting statistics, only the usual hand-wavy Levy flight arguments. They did find a power law of around-0.3 instead of the -0.5 we used for Poisson, so they may generate something equivalent to Poisson by drawing from a similar Levy distribution. Overall I find this violates Occam's razor, at least for this set of bird data .

Secondly, it seems that these differential growth curves have real significance in financial applications. More of the automated transactions look for short duration movements and I would think that ignoring counting statistics could lead the computers astray.


Epilogue

As an aside, when I first pulled the data off the USGS server, I didn't look closely at the data sets. It turns out that the years 1994,1995,1996 were included in the data but appeared to have much poorer sampling statistics. From 1994 to 1996, the samples got progressively larger but I didn't realize this when I first collected and processed the data.

Figure 6 : CDF of larger data sample.
Note the strange hitch in the data growth fluctuation curve.

At the time, I figured that the slope had a simple explanation related to uncertainties in the surveying practice. I also saw some similarities to the uncertainties in stock market returns that I blogged about recently in an econophysics posting.

Say the survey delta time has a probability distribution with average time -- the T most likely related to the time between surveys:
pt(time) = (1/T)*exp(-time/T)
then we also assume that a surveyor tries to collect a certain amount of data, x, during the duration of the survey. We could characterize this as a mean, X, or some uniform interval. We don't have any knowledge of higher order moments to we just apply the Maximum Entropy Principle
px(x) = (1/X)*exp(-x/X)
The ratio between these two establishes the relative rate of growth, rate = X/T. We can derive the following cumulative quite easily:
P(rate) = T*rate/(T*rate +X)
The yearly growth rate fluctuations of course turn out as the second derivative of this function. We take one derivative to convert :
dp(rate)/drate = 2*T/X/(1+rate*T/X)^3
On a cumulative plot as in Figure 6, this shows a power-law of order 2 (see the orange curve). Near the knee of the curve, it looks a bit sharper. If we use a uniform distribution of px(x) up to some maximum sample interval, then it matches the knee better (see the dashed curve).

So the simple theory says that much of the observed yearly fluctuation may arise simply due to sampling variations during the surveying interval. Plotting as a binned probability density function, the contrast shows up more clearly in Figure 7. In both cases is fit to X/T = 60. This number is bigger than unity because it looks like every year, the number of samples increases (I also did not divide by 15, the number of years in the survey).

But of course, the reason this maximum entropy model works as well as it does came about from real variation in the sampling techniques. Those years from 1994 to 1996 placed enough uncertainty and thus variance in the growth rates to completely smear the yearly growth fluctuation distribution.

Figure 7 : PDF of larger sample which had sampling variations.
Note that this has a much higher width than Figure 4.

Only in retrospect when I was trying to rationalize why a sampling variation this large would occur in a seemingly standardized yearly survey, did I find the real source of this variation. Clearly, the use of the Maximum Entropy Principle explains a lot, but you still may have to dig out the sources of the uncertainty.

Can we understand the statistics of something as straightforward as a bird survey? Probably, but as you can see, we have to go at it from a different angle than that typically recommended. I will keep an eye out if it has more widespread applicability; for now it obviously requires countable discrete entities.

Its about dreams, wishes, and hopes...

Kamis, 21 Agustus 2010 12.32 A.M.

Mau nulis tentang judul yang ada di blog hari ini,
blom bisa tidur, masih ngadep laptop, dengan pesbuk dan twitter yang tetap onlen, di istilahin parkir ini, melihat data data yang berupa angka dan begitu menjemukkan, paper kudu diselesein dulu lah, walo masih 70%, soale ntar malem kudu berangkat ke ibu kota buat nyariin duit OGIP UPN 2011, kalo yang belum tau, ne ntar TM UPN bakal ngadain Oil and Gas Intellectual Parade 2011 di bulan Maret 2011 besok, rangkaian acara dari bulan Desember 2010 ampe akhirnya Maret 2011.
Nanti lah, ane bakal kasih satu halaman khusus di Blog ane buat promosiin OGIP 2011. :D

Oke, kembali ke topic,
Dulu waktu pertama masuk TM, ane pernah mikir, mau ngapain ane masuk di tempat ini, bingung.
Terus dan terus bingung, ampe suatu ketika nemuin beberapa tokoh fiktif maupun non fiktif di buku yang ane baca, atau di film yang pernah ane tonton.

kayak gene neh quotes yang paling ane demenin, yang sesuai ama judul blog kali ini:

kalo ga punya mimpi dan harapan, orang orang seperti kita ini akan mati boi-Arai di Sang Pemimpi-Both from the book and the movie

Manjadda wa jadda-Alif Fikri-Negeri 5 menara

Karena yang membatasi kita atas dan bawah hanyalah tanah dan langit.-Alif Fikri-Negeri 5 menara

Orang boleh menodong senapan, tapi kalian punya pilihan, untuk takut atau tetap tegar-Alif Fikri-Negeri 5 Menara

Langit adalah kitab yang terbentang-Weh-Edensor

Bermimpilah, karena tuhan akan memeluk mimpi mimpimu-Arai-Sang Pemimpi

Farhanitrate and Prerajulisation-Ranchodas Chanchad-3 idiots

Sekolah tidak perlu membayar, hanya perlu seragam, sekolahlah dimanapun engkau mau-Ranchodas Chanchad-3idiots

lajahi Afrika yang eksotis dan Eropa yang megah, hingga bermuara ke altar suci Universitas Sorbonne Paris, Perancis.-Pak Balia-Sang Pemimpi

Memang itu hanya dari sedikit buku dan film yang ane baca, tapi cukup lah buat ngegambarin apa yang jadi judul blog ane malam ini,

Manusia dilahirkan untuk bermimpi, bahkan bokap ane pun dulu juga sering bermimpi buat bisa sekolah, walau beliau dari keluarga yang ga punya dan mungkin, kalo ga punya mimpi, detik ini, beliau masih akan memegang cangkul dan pergi ke sawah di setiap paginya. Dan mungkin, detik ini, aku ga bakal segemuk ini dan bakal megang cangkul juga buat ngurus sawah nerusin pekerjaan beliau --a

Jujur, bokap ane adalah Ayah nomer satu di seluruh dunia, bahkan dia rela berjalan puluhan Kilometer hanya demi mendaftar salah satu SMA Islam di Kota solo, hanya karena semangat, beliau sampe rela jalan kaki dari rumah eyang di daerah Nogosari, sampai di daerah Ps. Kembang Solo. Bayangkan, berapa jauhnya jarak itu, itu semua beliau lakukan hanya demi semangat beliau untuk mengubah nasib keluarganya.
Mengubah nasib untuk tidak menjadi seorang petani, dia ingin sekolah, dia ingin menjadi orang berpendidikan yang tau bagaimana cara mendidik anaknya yang tepat. (walau anaknya jadi anak nakal sekarang..zzzzzz...--a)

Jujur, ane masih kalah kalo dibandingin perjuangan bokap buat ngejar cita citanya.

Malu ane sebenere klo mau nantangin bokap buat bandingin sapa yang paling keras usahanya buat realisasi mimpi.

Yaaah, itulah namanya manejemen mimipi, bukan hanya manajemen reservoir seperti yang sedang ane kerjaan saat ini, kita kudu pinter memanage mimpi kita.
Ane masih belajar di tempat ini, masih buta akan peta persebaran tenaga kerja terutama di oil and Gas industry.
Penuh mati matian, bakal berusaha buat ga kalah dari bokap ane, ane yakin, doa yang pernah nyokap ane bacain di wukuf saat beliau haji, buat keliling dunia, seperti pak Balia ajarin buat arai dan ikal, bakal kesampaian buat ane, emang sih itu susah, tapi kenapa musti takut?

bahkan Lionel Messi ama mas David Beckham pun ngomong, "Impossible is nothing",
ga ada yang ga mingkin kok di dunia, walau pun hanya seorang pesakitan SPMB kayak ane ini. hahahahaha...(dibahas lagi)

Ga malu aku kalo dikatain anak swasta, bahkan di profil pesbuk ane, ane aja nulis, ane mahasiswa swasta, tapi kualitas international. Hahahaha...

ane yakin, amat yakin, kalo kita mau berusaha pasti semua bakal dikabulkan kok. Pesimistik merupakan sikap sombong, karena sama saja mendahului nasib, makanya yakin sajalah.

Buat temen temen yang kuliah di TM UPN, tetep semangat dalam ngejar cita cita,yang mau diwisuda, selamat ya maas mass, maaf besok ga bisa dateng wisudaan :)

jangan takut buat punya keinginan buat dapet duit (bukan cari kerja tapi cari duit, nanti dimarahin pak topan) dari Multi national Oil company sekalipun dan pergi keliling dunia seperti kepinginan ane,
jangan takut dicap sebagai anak kelas dua, kita nomer satu! kayak mars perminyakan lah!
jangan takut pernah dikatain jelek sama orang.
jangan takut walau ada yang ngatain kita water engineer (aku merasa didzolimi...hahaha..)
jangan takut untuk bermimpi!

bahkan dosen sekelas Ir. Y. Lela Widagda, MT pun pernah ngomong, kita butuh Jurusan Mimpiologi , buat kita kita ini biar ga takut buat mimpi!! :)

Saturday, October 16, 2010

Tower of Babel, How languages diversify

One pattern that has evaded linguists and cognitive scientists for some time relates to the quantitative distribution in human language diversity. Much like how plant and animal species diversify in a specific pattern, with very few species dominating within an ecosystem and relatively few species exceedingly rare, the same thing happens with natural languages. You find a few languages spoken by many people, and very few spoken seldomly,with the largest number occupying the middle.

Consider a simple model of language growth whereby adoption of languages occur over time by dispersion. The cumulative probability distribution for the number of languages is
P(n) = 1/(1+1/g(n))
This form derives from the application of the maximum entropy principle to any random variate where one only knows the mean in the growth rate and an assumed mean in the saturation level. I refer to this as entropic dispersion and have used this many applications before so I no longer feel a need to rederive this term every time I bring it up.

The key to applying entropic dispersion is in understanding the growth term g(n). In many cases n will grow linearly with time so the result will assume a hyperbolic shape. In another case, an exponential growth brought up by technology advances will result in a logistic sigmoid distribution. Neither of these likely explains the language adoption growth curve.

Intuitively one imagines that language adoption occurs in fits and starts. Initially a small group of people (at least two for arguments sake) have to convince other people on the utility of the language. But a natural fluctuation arises with small numbers as key proponents of the language will leave the picture and the growth of the language will only sustain itself when enough adopters come along and the law of large numbers starts to take hold. A real driving force to adoption doesn't exist, as ordinary people have no real clue as to what constitutes a "good" language, so that this random walk or Brownian motion has to play an important role in the early stages of adoption.

So with that as a premise, we have to determine how to model this effect mathematically. Incrementally we wish to show that the growth term gets suppressed by the potential for fluctuation in the early number of adopters. A weaker steady growth term will take over once a sufficiently large crowd joins the bandwagon.
dn = dt / (C/sqrt(n) + K)
In this differential formulation, you can see how the fluctuation term which goes as 1/sqrt(n) suppresses the initial growth until it reaches a steady state as the K term becomes more important. Integrating this term once and we get the implicit equation:
2*C*sqrt(n) + K*n = t
Plotting this for C=0.007 and K=0.000004, we get the following growth function.

Figure 1 : Growth function assuming suppression during early fluctuations

This makes a lot of sense as you can see that growth occurs very slowly until an accumulated time at which the linear term takes over. That becomes the saturation level for an expanding population base as the language has taken root.

To put this in stochastic terms assuming that the actual growth terms disperse across boundaries, we get the following cumulative dispersion (plugging the last equation into the first equation to simulate an ergodic steady state):
P(n) = 1/(1+1/g(n)) = 1/(1+1/(2*C*sqrt(n) + K*n))
I took two sets of the distribution of population sizes of languages (DPL) of the Earth’s actually spoken languages from the references below and plotted the entropic dispersion alongside the data. The first reference provides the DPL in terms of a probability density function (i.e. the first derivative of P(n)) and the second as a cumulative distribution function. The values for C and K were as used above. The fit works parsimoniously well and it makes much more sense than the complicated explanations offered up previously for language distribution.


Figure 2 : Language diversity (top) probability density function (below) cumulative. The entropic dispersion model in green.

In summary, the two pieces to the puzzle are assuming dispersion according to the maximum entropy principle, and a suppressed growth rate due to fluctuations during the early adoption. This gives two power law slopes in the cumulative; 1/2 in the lower part of the curve and 1 in the higher part of the curve.

References
  1. Scaling Relations for Diversity of Languages (2008)
  2. Competition and fragmentation: a simple model generating
    lognormal-like distributions
    (2009)
  3. Scaling laws of human interaction activity (2009)
    Discussions on the fluctuation term.


NY Math Teacher Howard A. Stern Uses Ingenuity To Overcome Failure Statistics

The public school teacher highlighted in the linked article has this to say:

"So much of math is about noticing patterns," says Stern, who should know. Before becoming a teacher, he was a finance analyst and a quality engineer.

I always try to seek interesting patterns in the data, but more to the point, I try to actually understand the behavior from a fundamental perspective.

One way Stern uses technology is by helping his students visualize his lessons through the use of graphing calculators.

Stern has it exactly right, if we treat knowledge seeking as a game, like a suduko puzzle, we can attract more people to science in general.

I think that the pattern in language distribution has similarities to that of innovation adoption as well, similar to what Rogers describes in his book "Diffusions of Innovations". I will try to look into this further as I think the dispersive arguments holds some promise as an analytical approach.


Thursday, October 14, 2010

I am an engineer and i am an actor

again i will discuss about my new life, my life as a rookie in Petroleum Engineer.

Di cerita sebelumnya (kayak sinetron aje, bener kata pacar kalo ane korban sinetron), i have discussed that i never known what type of department, Petroleum Engineer is it?

Ada di dimensi mana tuh jurusan, ada di galaksi mana jurusan itu ampe ane mikir, sapa sih sebenere orang yang mau maunya ngrencanain buat Jurusan teknik perminyakan ini bisa diperbincangkan dan harus di diskusikan secara ilmiah dan komprehensif??
(bener bener malesin banget dah belajar kek ginian, mending jurusan pangan biar bisa kerja kayak mas bondan, mak nyuuusss)

kembali ke pembicaraan,

dulunya waktu SMA, ane aktif di teater, sering ikut pementasan juga, dan ane percaya, hal ini bagi sebagian rekanku di Jurusan ini merupakan hal yang aneh. (ane aja dulu sebelum aktif menganggap teater itu tempate anak2 cewek-tapi bukan berarti ane bences boo'). Ga tau ngapa, gw malah menikmati peran gw disini, peran gw yang kudu memerankan sosok lain, belajar untuk bisa menjadi orang lain, belajar untuk menempatkan posisi gw sebagai orang lain. (sumpah ga penting, tapi jujur sekarang ini ane baru ngerti kalo kita nanti menjadi seorang sales engineer di services company, i believe this tips are beneficial)

Makanya gara gara semua itu, ane sempet punya pikiran buat masuk di ISI aja buat ambil jurusan Teater, tapi kalo itu terjadi, bisa bisa digantung ama nyokap ane. zzzzz..-,-

Di tulisan sebelumnya, ane ngomong, kalo dulu waktu kelas 3 SMA, gw ngomong ga bakalan masuk teknik, dan secara kebeltulan, keadaan merubah arah haluan kapalku dan aku malah masuk teknik.

kalo kata Raditya Dika di Bukunya #MMJ yang nyritain kisah ketemuannya sama si sherroo, inilah yang disebut "cosmological coincident", inilah suatu kebetulan yang tidak kita rencanakan.

Dulu saya masuk teater juga tidak saya rencanakan, saya tiba2 aja dipaksa masuk dan saya berprestasi disana, saya secara tidak terencanakan masuk Jurusan Teknik Perminyakan gara gara menjadi pesakitan SPMB dan disini saya menemukan banyak manfaat.

hal ini membuktikan tidak semua yang kita harapkan itu adalah jalan yang terbaik buat kita (sok betul ane), ga semua yang kita inginkan itu terkabul, dan sapa tau pergantian dari apa yang kita harapkan dari yang tak terkabulkan sebelumnya itu, malah jadi sesuatu yang indah buat kita.

Percaya aja, kalo kita mau berusaha, pasti semua akan dikabulin, jangan takut untuk mimpi cuy, kita dilahirin untuk bermimpi.
malah kata salah satu dosenku produksi di sini, di teknik perminyakan, harusnya ada yang namanya jurusan mimpiologi , dengan itu, kita tau arah mana yang harus kita tempuh untuk meraih semua itu. :)

kalo kata arai di film sang pemimpi, "kalo orang orang seperti ga punya mimpi, orang orang seperti kita akan mati boy"-andrea hirata.

yaaah, emang sih ini ga penting, tapi aku bangga kalo aku memang pernah menjadi seorang aktor dan nantinya akan menjadi seorang enfineer. ;)

Don't Tell Mom I Work on the Rigs: She Thinks I'm a Piano Player in a Whorehouse

Ketika baca quote ini, gw cuma bisa tercengang, ama mikir, "Anjiss, masak kerja di rig drilling disamain ama kerja jadi pianist di rumah bordir?"
bener bener parah.

Tapi quote ini gw dapetin waktu silaturahim ke salah satu senior gw yang kerja sebagai Mud Engineer di Thailand, dia crita ada seorang crew nya itu baca buku karangan Paul Carter yang judulnya sama dengan judul blog yang gw tulis hari ini.

Paul Carter menulis semua pengalamnnya ketika bekerja diatas rig floor, mencoba mengadu nyawanya melawan kerasnya suatu pekerjaan pemboran, bahkan saking keras dan kotornya pekerjaan itu, dia tidak sanggup menceritakan tentang pekerjaannya itu di depan ibunya sendiri. Bahkan lebih memilih mengatakan dia bekerja sebagai pianist di rumah bordir daripada ibunya tau setiap hari anaknya bersenggama dengan maut di rig floor.

hmm, jadi teringat pengalaman gw sebelum masuk di jurusan ini, saat gw ngomong ke nyokap kalo gw mau masuk di Jurusan Teknik Perminyakan, pikiran nyokap cuma satu, "Anaknya bakal jualan bensin".

Wajar sih kalo nyokap ngomong gitu, kosakata teknik perminyakan bisa dianggap baru di lingkungan telinga keluarga kami, bahkan semua masyarakat di lingkungan tempat aku tinggal. Sampai mereka tega ngatain gw bakal jualan bensin. (-.-"

Ada peristiwa yang menarik, sekitar bulan April 2010 kemaren, Alhamdulilah penulis dapat kesempatan untuk melaksanakan On Job Training di salah satu perusahaan migas multi national yang ada di Papua, di kepala burung.

Sungguh pengalaman yang tak terbayangkan bisa sampai ke tempat se indah itu.

Sebelum gw berangkat kesono, ke tuh tanah timur Indonesia, gw dipanggil ma nyokap,
gw cuma mikir, tumben tumbenan ini dipanggil, mau dikasih uang saku apa ya.
Eh, langsung aja nyokap ngomong "masak sih praktek jualan bensin sampai ke Papua segala?"
langsung dah gw senyum kecut depan nyokap gw. zzzzzzz...-,-

yaaah, cuma intermeso itu mah.

Disini gw cuma mau ngomongin, di Industri ini, industri perminyakan, kita akan selalu berhadapan dengan yang namanya maut. Ga main2 yang kita lawan adalah bumi, bukan sesuatu hal yang kecil, kita akan banyak bertarung melawan semua hal yang berkaitan dengan yang namanya pressure dan temperatur, sesuatu hal yang bila tidak bisa di manage dengan baik, akan sangat mudah menimbulkan ledakan dan menghancurkan tubuh kita dengan mudah.

Sapa sih yang mau kerja di tempat kotor seperti itu? Benar2 di pelosok pedalaman suatu pulau, amat jaauuuh dari kesan bersih dan rapi, jauh dari sinyal HP, jauh dari keramaian, ga ada kemacetan (pernah di tempat gw On Job Training jarak 20 KM ditempuh 10 menit gara2 ga ada kendaraan lain), ga ada supermarket, ga ada mall, ga ada bioskop, panas nya minta ampun, yang dilihat pohon dan kalo beruntung ketemu macan ato gajah, itu kalo onshore (pemboran di darat), kalo di offshore (pemboran lepas pantai) tiap hari sehari 24 jam sebulan 30 hari yang diliat cuma air dan kayake laut ama langit ga ada batas. Belum kalo ada badai kayak di pirates and caribean (lebai).

kalau semua itu dibayangin, apa kamu kamu ini mau kerja di tempat seperti itu?
belum lagi dengan lingkungan pekerjaan yang amat sangat panas, bukan cuma panas matahari yang selalu menyengat, panasnya mulut2 para pekerja yang ada di atas rig floor juga ikut memanaskan isi otak anda anda yang berniat bekerja di tempat ini.

Gw pernah denger cerita, based on true story, ada seorang atasan dari suatu services company bahkan berani memukul engineernya dengan botol sampai pecah, gara2 mereka gagal dalam melakukan suatu operasi directional drilling (pemboran miring).

Benar benar pekerjaan yang amat kotor dan berbahaya deh menurut gw.

Ditambah kita yang harus menanggung resiko jauh dari keluarga, ditempat yang amat sepi kayak gitu, jauh dari anak istri (kalo dah punya), benar2 pekerjaan yang mengerikan.

memang, ada hal lain yang dibayarkan bila kita sanggup bertahan di tempat ini, iya uang yang berlimpah.
bahkan ada seorang rekan yang juga belajari di jurusan yang sama namun di lain universitas, dia di Jakarta tepatnya. Menulis sebuah note tentang pekerjaan kita di FB. Seperti ini:

Working in the oil industry:

1. We work in weird shifts ... Like prostitutes.

2. They pay you to make the client happy ... Like prostitutes.

3. The client pays a lot of money, but your employer keeps almost every penny ... Like prostitutes.

4. You are rewarded for fulfilling the client's dreams ... Like prostitutes.

5. Your friends fall apart and you end up hanging out with people in the same profession as you ... Like prostitutes.

6. When you have to meet the client you always have to be perfectly groomed ... Like prostitutes.

7. But when you go back home it seems like you are coming back from hell ... Like prostitutes.

8. The client always wants to pay less but expects incredible things from you ... Like prostitutes.

9. When people ask you about your job, you have difficulties to explain it ... Like prostitutes.

10. Everyday when you wake up, you say: I'M NOT GOING TO SPEND THE REST OF MY LIFE DOING THIS ****"..... Like prostitutes.


The only difference is the prostitutes can take Christmas and New Year's Eve off and they actually DO make a lot of Money!!! If you know someone in the oil industry please share this email with them so they don't feel bad anymore.... Like prostitutes!!!

seperti itulah, bukan cuma kami disini yang kuliah di Jogja, yang di Jakarta juga merasakan hal yang sama.

Inilah Oil and Gas industry, emang sih gw belum kerja, belum bisa ngalamin, cuma bisanya bacot kagak bener kek gini, gw aja yang kuliah di tempat kek ginian masih gemeter ngebayangin gimana ntar gw kerja. (-_-"

Pertanyaane :"tahan ga gw kerja di tempat kek gini?"
bisa bisa gw malah kencing mulu di celana.zzz...-,-

tapi sungguh percaya ama gw, oil and gas industry adalah industri yang benar benar riskful activities, benar benar crazy activities, bahkan lebih baik bekerja di tempat seperti whorehouse yang tiap kerja ga diawasi malaikat pencabut nyawa. (horor abis dah)

Sekali lagi hidup adalah pilihan, jika anda berani memutuskan untuk bekerja ditempat seperti ini, ambil semua resiko itu, ambil hikmah didalamnya. tapi saran gw, jangan ngomong ke keluarga deh, kerasnya perjuangan kita mencari nafkah. Kasih tau yang baik baik aja. Dan semoga mereka doakan yang terbaik buat kita2 yang kerja di tempat ginian. jangan cuma tau enake aja. ;)

wajar jika seorang Paul Carter mengatakan "Don't Tell Mom I Work on the Rigs: She Thinks I'm a Piano Player in a Whorehouse"


penampakan gw didepan Blow Out Preventer di perusahaan minyak di daerah tuban(ne alat yang nge jaga biar saat drilling ga meledak, gitu dah)


penampakan gw didepan drilling rig (buat ngebor gan) itu sekitar 2500 HP (hore power), tertarik kerja di gituan??

Wednesday, October 13, 2010

Multiple Proppant Fracturing of Horizontal Wellbores


Overview
Throughout the early 90s, despite the introduction of horizontal well technology, production declined from BP’s Valhall field. In 1995 BP and Schlumberger introduced multiple proppant fracturing of the horizontal
wells. Since then, this technology has enabled Oil & NGL production to be increased by in excess of 50%.

Proppants are used to keep the walls of a fracture apart so that a conductive path to the wellbore is retained after hydraulic pumping has stopped. Placing the appropriate concentration and type of proppant in the fracture is critical to the success of fracturing treatments. Throughout the Valhall implementation the fracture spacing utilized has been determined by field calibrated production modeling. Optimum fracture dimensions and spacing along the horizontal wellbore are determined using an implicit reservoir simulator.

Results are used to determine economic indicators such as the Internal Rate of Return and the Net Present Value, depending on fracture spacing, fracture length, the cumulative risks and the effect of delayed production resulting from increased fracture frequency. This completion technique has proved a significant technical and economic success in the Valhall field.

However, the real success has been the synergy achieved between coiled tubing, perforation and fracturing operations that allows simultaneous operations (SIMOPS) to occur.


Technical Description

The Valhall field is an upper cretaceous, asymmetric chalk anticline that forms an overpressured, under saturated, oil reservoir located in the Norwegian North Sea. The field holds an estimated 813 MMSTB and 843 Bcf of gas. Current production reaches 87,000 BOPD from 43 wells on the main Drilling Platform (DP) and the bridge connected Wellhead Platform (WP).
The completion methodology utilized has been a developing strategy due to poor chalk stability that leads to formation influx and tubular collapse. Completion strategies have evolved from indirect, proppant fractured vertical wells, to gravel packed direct proppant fractured wells, then to horizontal blanket perforated wells. Initial productivity from the horizontal wellbores proved encouraging but by 1994 production had dropped by 20% due to high incidences of formation influx and terminal liner collapse.

Multiple proppant fractured completions were initiated in 1995 to couple the high productivity experienced from the horizontal wellbores with the longevity of the proppant fracture completions. Continued production gains have driven all
subsequent wells to be completed in this manner. In a typical 1,000 m horizontal section as many as 7 proppant fracture zones yield production rates as high as 10 - 12,000 STB/day compared to the 2 - 4,000 STB/day of earlier horizontal well completion techniques.

The first completion of this type in the field required 18 operating days to place 3 proppant fractures in a well drilled from the DP platform - an average of 6 days per zone. Subsequent development drilling was planned to take place from the WP platform. This requires a jackup rig to cantilever over the structure and drill in a 19 well slot arrangement. Exposure to such a high cost environment prompted an evolution in the way the completions are executed in order to significantly reduce both time and cost. Today each zone is completed in less than 2 days
by using specially developed techniques and tooling.
Once the liner and production tubing are set in place, all subsequent completion operations associated with the multiple fracture treatments do not require the services of a derrick and instead are performed by 23/8 inch coil tubing. The financial success of the WP development centered on making simultaneous drilling, production and completion operations a reality. The stimulation and coil tubing completion operation, which has come to be known as SIMOPS, is based on the main deck of the WP.
A total of 470 operating days have been saved from the jackup drilling rig schedule from 1996 through 1999 by performing these operations using SIMOPS.

Petrofisik 4th week: The Jackpot


Answer this following question!

1. Apa yang dinamakan reservoir? Sebutkan Petroleum system? Sebutkan komponen reservoir? Gambarkan suatu sistem reservoir lengkap beserta isinya dalam antiklin!

2. Apa yang dimaksud dengan petrofisik? Sebutkan apa saja?

3. Apa yang dimaksud dengan coring? Data Petrofisik apa saja yang bisa didapatkan dari coring? Apa bedanya routine core dan Special core? Apa yang didapat dari routine core dan special core analysis?

4. Apa yang dimaksud dengan well log? Data petrofisik apa saja yang bisa didapatkan dari well log? Sebutkan jenis log nya? Cara kerjanya?

5. Jelaskan pengertian pengertian dibawah ini!
a. Saturasi? Metode metode yang digunakan untuk mendapatkan nilai saturasi?
b. Porositas? Ada berapa jenis porositas yang ada? Sebut dan Jelaskan?
c. Critical oil saturation
d. Residual oil saturation
e. Critical gas saturation
f. Critical water saturation
g. Initial water saturation
h. Intergranular porosity
i. Intragranular porosity
j. Pendular rings
k. Funicular
l. Permeabilitas? Bagaimana kita bisa mendapatkannya dan sebutkan faktor yang mempengaruhinya!

6. Tuliskan dan gambarkan bukti bahwa porositas absolute maksimum dari cubic sphere adalah 47.64%? Rhombohedral sekitar 26%? Dan cubic packing sekitar 12.5%?

7. Jelaskan mengenai permeabilitas relatif minyak dalam sistem tiga fasa!

8. Terangkan mengenai apa itu rock compressibility, pengaruhnya terhadap reservoir, dan correlations of compressibility! Gambar bila ada grafik!
a. Hall's corellation
b. Van der Knapp's corellation
c. Newman's corellation

9. Terangkan mengenai apa itu wettabilitas! faktor apa yang berpengaruh dalam wettabilitas dan gambarkan oil surrounding water dropplets!

10. Terangkan apa yang dinamakan Tekanan kapiler dalam batuan reservoir! Apa yang dinamakan entry pressure! Gambarkan grafik Pc VS Sw! Apa itu hysteresis! Terangkan maksud dari grafik itu!

11. Apa yang dimaksud dengan J-Function Capillary Pressure? Apa kegunaan dari dihitungnya J-Function? Tulis rumusnya!

12. Jelaskan mengenai gravel pack dan sandscreen, jelaskan perbedaan keduanya? Gambarkan skema pemasangan gravel pack dan sandscreen lengkap dengan well diagram dari surface sampai TVD! (Tanya senior apa itu well diagram! Gambar lengkap dengan seluruh casing di semua trayek-cased hole)

13. Jelaskan apa itu Acidizing! Mengapa dilakukan Acidizing? Apa itu Skin? Samakah skin dengan scale? Dampak keduanya terhadap permeabilitas? Tulis rumus menghitung skin! Sebutkan dan jelaskan jenis acidizing! Petrofisik yang mana yang berpengaruh terhadap acidizing? Apa hubungan antara dilakukannya acidizing dengan petrofisik?

14. Peralatan untuk mengukur permeabilitas relatif seperti diatas digunakan dalam proses aliran steady-state untuk memperoleh data berikut pada temperatur 70 derajat F
Core
Sandstone
Panjang = 2,30 cm
Daimeter = 1,85 cm
Luas = 2,688 cm2
Porositas = 25,5 %

Fluida
Brine 60.000 ppm
Gravity minyak 40o API
densitas air = 1,07 cp
densitas oil = 5,5 cp

data dari analisa laboratorium:


Gambar kurva permeabilitas relatif vs saturasi air dan minyak!! Ditulis secara benar dan urut mengenai urutan pengerjaan! Terangkan maksud dari grafik K vs Sw tersebut (seperti tugas minggu kemarin)

15. Tuliskan 5 hal yang tidak disukai dalam praktikum Analisa Inti batuan beserta saran! 5 Hal yang tidak disukai mengenai asisten beserta saran! 5 hal yang tidak disukai mengenai tugas mingguan beserta saran! 5 hal yang anda sukai dari praktikum Aib! 5 Hal yang anda sukai dari asisten! dan 5 hal manfaat dari tugas mingguan! Tulis asisten favorit!

16. Tuliskan mimpi anda setelah lulus dari Teknik Perminyakan UPN dalam Bhs. Inggris! Ingin bekerja dimana anda nanti, dan ingin menjadi seperti apa anda nanti! ditulis 350 kata. Ekspresikan dalam tulisan berbahasa inggris!

17. Ditulis di kertas bekas saja. Seperti minggu lalu. Dikumpulkan secara bersama tiap plug, harus ada koordinasi tiap plug! Jangan sampai ada pengumpulan sendiri2! Dikumpulkan ke koord masing2! Harus Ketemu! Hari Senin tanggal 18 Oktober 2010!!

Semoga Tuhan Selalu beserta adek adek semua. Tetap Berusaha. Kita bangun Perminyakan UPN menjadi lebih baik.

Tuesday, October 12, 2010

Stock Market as Econophysics Toy Problem

Consider a typical stock market. It consists of a number of stocks that show various rates of growth, R. Say that these have an average growth rate, r. Then by the Maximum Entropy Principle, the probability distribution function is:
pr(R) = 1/r*exp(-R/r)
We can solve this for an expected valuation, x, of some arbitrary stock after time, t.
n(x|t) = ∫ pr(R) δ(x-Rt) dR
This reduces to the marginal distribution:
n(x|t) = 1/(rt) * exp(-x/(rt))
In general, the growth of a stock only occurs over some average time, τ, which has its own Maximum Entropy probability distribution:
p(t) = 1/τ *exp(-t/τ)
So when the expected growth is averaged over expected times we get this integral:
n(x) = ∫ n(x|t) p(t) dt
We have almost solved our problem, but this integration reduces to an ugly transcendental function K0 otherwise known as a modified Bessel function of the second kind and order 0.
n(x) = 2/(rτ) * K0(2*sqrt(x/(rτ) ))
Fortunately, the K0 function is available on any spreadsheet program (Excel, OpenOffice, etc) as the function BESSELK(X;0).

Let us try it out. I took 3500 stocks over the last decade (since 1999), and plotted the histogram of all rates of return below.


The red line is the Maximum Entropy model for the expected rate of return, n(x) where x is the rate of return. This has only a single adjustable parameter, the aggregate value rτ. We line this up with the peak which also happens to coincide with the mean return value. For the 10 year period, rτ = 2, essentially indicating an average doubling in the valuation of the average stock. This doesn't say anything about the stock market as a whole, which turned out pretty flat over the decade, only that certain high-rate-of-return stocks upped the average (much like the story of Bill Gates entering a room of average wage earners).

The following figure shows a Monte Carlo simulation where I draw 3500 samples from a rτ value of 1. This gives an idea of the amount of counting noise we might see.

I should point out that the MaxEnt model shows very little by way of excessively fat tails at high returns. A stock has to both survive a long time and grow at a rapid enough rate to get too far out in the tail. You see that in the data as only a couple of the stocks have returns greater than 100x. I don't rule out the possibility of high-return tails but we would need to put even more disorder in the pr(R) distribution than the MaxEnt provides for a mean return rate. The actual data seems a bit sharper and has more outliers than the Monte Carlo simulation, indicating some subtlety that I probably have missed. Yet, this demonstrates how to use the Maximum Entropy Principle most effectively -- you should only include the parameters that you can defend. From this minimal set of constraints you observe how far this can take you. In this case, I could only defend some concept of mean in rτ and then you get a distribution that reflects the uncertainty you have in the rest of the parameter space.

The stock market with its myriad of players follows an entropic model to first-order. All the agents seem to fill up the state space so that we can get a parsimonious fit to the data with an almost laughably simple econophysics model. For this model, the distribution curve on a log-log plot will always take on exactly that skewed shape (excepting for statistical noise of course) -- it will only shift laterally depending the general direction of the market.

The stock market becomes essentially a toy problem, no different than the explanation of statistical mechanics you may encounter in a physics course.

Has anyone else figured this out?

[EDIT]
Besides the slight fat-tail, which may be due to potential compounding growth similar to that found in individual incomes, the sharper peak may also have a second-order basis. This could result from a behavior called implied correlation which measures the synchronized behavior among stocks in the market. According to recent measurements, the correlation has hit all-time highs (the last around October 5). Qualitatively a high correlation would imply that the average growth rate r would show much less dispersion in that variate, and the dispersion would only apply to the length of time, t, that a stock rides the crest. Correlation essentially removes one of the parameters of variability from the model and the distribution sharpens up. The stock distribution then becomes the following simple damped exponential instead of the Bessel.
n(x) = 1/(rτ) * exp(-x/(rτ))
The figure below shows what happens when about 40% of the stocks would show this correlation (in green). The other 60% show independent variability or dispersion in the rates as per the original model.

I don't think this makes the collective stock behavior and more complex. I think it makes it simpler in fact. Implied correlation actually points to the future in the stock market. Dispersion in stock returns will narrow as all stocks move in unison. It makes it even more of a toy, with computers potentially dictating all movements.

Implied correlation has risen in the last few years (from here)


References
I personally don't deal with the stock market, preferring to watch it from afar. I found a few papers that try to understand this effect, but most just try to brute force fit it to various distributions.
  1. Analysis of same data from Seeking Alpha
  2. This paper is close but no cigar. It looks like they "detrend" the data to get of the skew, which I think misses the point :
    "Microscopic origin of non-Gaussian distributions of financial returns" (2007)
  3. This book has info on the Bessel distribution:
    "Return distributions in finance", J. Knight and S. Satchell
  4. Interesting from an econophysics perspective.
  5. This book appears worthless:
    "Fat-Tailed and Skewed Asset Return Distributions", S.T. Rachev, F.J. Fabozzi, C Menn

TURN OVER!!!! SHOW YOUR ACTION!!!!

Ga tau kenapa rasanya pengen nulis ini,

TURN OVER, and SHOW YOUR ACTION...

mungkin itu bisa dianalogikan dengan seklumit pengalaman saya yang bisa dikatakan luar biasa (hiperbol), benar-benar turn around seperti yang pernah dikatakan oleh Rhenald Kasali, ketua S2 fakultas ekonomi Universitas Indonesia.

Dibutuhkan energi yang besar untuk memutar balik arah yang salah selama ini kemudian meneruskannya dengan perubahan, mengawalnya dan akhirnya menyelesaikan perubahan itu sendiri (Rhenald Khasali : 2005)

Dulu saat saya menginjak kelas XII IPA 1 di salah satu SMA tertua di Kota Solo, saya memproklamirkan diri saya untuk tidak mengambil jurusan teknik sebagai arah yang akan saya ambil di tingkat Universitas.

Namun sungguh, amat sangat berbeda jauh 180 derajat (bukan koprol) dari Mimpi untuk mengenakan jas putih dan membawa alat pengukur detak jantuk yang dikalungkan di leher (udah lupa namanya, ada yang tau?).

Benar benar dunia baru, dunia yang asing, dunia ilmu pasti dengan penulisan hitam diatas putih yang tak terganggu gugat (emang apaan).

Sekitar 3 tahun 4 bulan lalu (i have been counted it), akhirnya aku memutuskan untuk turned around mencoba mundur karena kalah dari keadaan. Bisa dibilang saat itu adalah the worst point in my life, got many things which are crushing my life slowly.

Sempat aku kabur dari rumah untuk menyalahkan diri (namanya aja sok2an), menyalahkan kebodohanku karena aku gagal dalam seleksi massal tingkat nasional yang diikuti ratusan ribu mahasiswa di Indonesia.

Hmm, sempet sih saat itu berencana untuk menunda studi ku satu tahun, mencoba di tahun sesudahnya untuk kembali beradu nasib untuk bisa memakai jas putih yang penuh kebanggaan itu (dulu).

Tapi sungguh, semua itu merupakan kekalahan terbesar dan terbodoh di dunia jika aku tetap melakukan itu. Bahkan lebih bodoh dari kegagalanku menembus tes seleksi yang menyakitkan itu.

Seperti yang Rhenald Kasali bilang, Putar Arah sekarang juga!
Saat itu, aku mencoba memutar arah haluan masa depanku untuk menjadi seorang insinyur, dan mungkin tindakan putar arah ini, sama saja melakukan tindakan yang lebih bodoh dari menunda studi atau gagal di SPMB. Benar benar buta akan dunia baru ini, bahkan ibuku pun berfikir, jika aku masuk dunia ini, aku akan bekerja di SPBU dan mengisi bahan bakar untuk mobil seseorang (benar-benar ga tau apa2).

Iya, Jurusan Teknik Perminyakan, Jurusan yang agak terdengar aneh di telinga masyarakat di kota kelahiranku yang memang sungguh jauh dari kesan sebagai bumi reservoir (tempat terakumulasinya hidrokarbon).
Bisa dibilang gila sih, bakalan masuk di Jurusan Asing yang ga semua orang tau keberadaannya, dengan notabene aku bakalan dicap sebagai orang nomer dua, sebagai pesakitan PTN dan akhirnya memasrahkan diri di PTS, bahkan sodaraku sendiri ada yang meremehkan pilihanku ini (sakit dia itu).

Iya, dan akhirnya setelah dibantu dengan petunjuk-Nya,
aku memilih untuk meneruskan studiku di tempat antah berantah ini, di PTS yang dulu ketika aku tes UM salah satu PTN di jogja lewat didepannya dan bertanya dalam hati, "kampus apaan ini ini? Kok kayak GOR" (sumpah dulu aku ga tau apa nama ne kampus)

Aku kubur dalam dalam semangat untuk mengenakan jas putih itu, menanggalkan mimpi untuk mendapatkan 2 huruf "dr." tepat didepan namaku. Mencoba memutar arah 180 derajat untuk memasuki tempat yang dulu aku sendiri ga ngerti kenapa aku bisa terpikir untuk masuk tempat ini. Atau bahkan ayahku ga ngerti kalau jurusan ini ada. -,-

Benar benar masa masa suram, my first time went out far away from my parents and family, my first time in the 3x3 room lonely, my first time i have crushed with something called destiny.

zzzzzz...benar benar masa yang memuakkan di tempat ini, serasa pengen kabur aja.

Bahkan jika inget saat itu, rasanya pengen kupukuli satu satu, orang yang bikin moodku selalu berubah setiap malam. Karena ga bisa bebas di tempat yang digunakan untuk "belajar".

daaaaan, sudah 3 tahun 4 bulan (i have been counted it i said!)aku mondar mandir dari sudut barat ke timur gedung 3 lantai itu. Hanya untuk tau, bagaimana minyak bumi itu dapat terbentuk, bagaimana menghitung, memperkirakan letak dan keadaannya, serta memikirkan dengan bodoh cara mengambilnya.

namun, dengan keyakinan dan usaha, saya merasa sangat beruntung dibuang untuk masuk ditempat ini, saya tidak takut dulu sodara saya meremehkan saya, saya tidak takut dianggap sebagai pesakitan PTN, saya tidak takut dicap sebagai manusia nomer 2.

karena kami bukan pesakitan, karena kami bukan nomer 2, kami adalah Juara dan kami adalah engineer berkualitas di lapangan. Kami yakin akan semua itu.

saat itu, untuk kesekian kalinya, saat menginjakkan semester 4 di tempat ini, kembali saya memproklamirkan diri untuk tidak akan pernah mengambil Reservoir sebagai technical major saya di Universitas.(Sumpah demi Tuhan yang menguasai hari akhir, ini hanya karena saya merasa sangat idiot di hal ini, serasa sangaaat susaaaaah sekali untuk mempelajari materi ini, bukan karena sok sokan atau apa, saya merasa lemah mental jika menghadapi disiplin ilmu in )

Dan saat ini, detik ini, ketika saya menulis blog ini, saya berencana mengambil Reservoir Enginnering sebagai technical disciplines saya utnuk komprehensif (benar2 ga konsisten). Walaupun begitu, walau saya terlahir sebagai orang yang idiot tidak konsisten seperti ini, saya yakin bahwa saya akan menemukan hal yang lebih menakjubkan dari mimpi saya terdahulu. Lebih fantastis. :)

hmm, sebenarnya yang saya sampaikan diatas itu ga penting, intinya,

"jika kamu memerlukan sesuatu yang fantastik untuk pelayaran mimpimu, putar arahlah haluanmu, terkadang memutar haluan tidak akan membuat kapalmu karam, namun kembali menemukan perairan dan kamu bisa meneruskan kembali pelayaranmu untuk dapatkan mimpi yang lebih fantastis" -Muhammad Afif Ikhsani (2010)


"Jangan takut untuk bermimpi dan memutar arah unuk mendapatkan mimpi yang lebih tinggi dari mimpimu sebelumnya."
-Muhammad Afif Ikhsani (2010)

Semoga Allah bersama kita.

Yogyakarta, 13 Oktober 2010
Di iringi backsound lagunya Ipang yang meraih mimpi.


Acknowledge for All my friends

SIDJIE'07 ( Sekumpulan Individu Djenius Dua Belas IPA Sidjie 2007)
KALIAN ADALAH CALON ORANG TERBAIK DI BIDANG YANG SUDAH KALIAN PILIH!!! TERIMA KASIH SUDAH MENGUBAH SAYA DAN CARA BERFIKIR SAYA!!!


Wildcat TM'07
MARI KITA BERJUANG MENCARI JUDUL KOMPREHENSIF REKAN2 2007!!!!
SELESAIKAN KOMPREHENSIF, TA, dan KITA LULUS BARENG2 OKTOBER 2011!!!

Thursday, October 7, 2010

Black-Scholes

Games for suits. This post has no relevance in the greater scheme of things.

As a premise, consider that the financial industry needs instruments of wealth creation that work opposite to that of stocks. For example, when stock prices remain low, then something else else should take up the slack -- otherwise important people won't make money. Wall Street invented derivatives, options, and other hedging methods to serve as an investment vehicle under these conditions.

We can try to show how this works.

If S is the stock price, then V ~ 1/S is an example "derivative" that works as a reciprocal to price. This becomes the normative description and defines the basic objective as to what the investment class wants to achieve -- an alternate form of income that balances swings in stock price, potentially reducing risk.

Further, we make the assumption that the derivative will grow or decline over time.

So we get:
V(S,t) = K/S * exp(a*t)

If a > 0 then the derivative will grow and if a is less than zero than the derivative will damp out over time. The term K is a constant of proportionality.

The infamous Black-Scholes equation supposedly governs the behaviour of derivatives with respect to stock prices (and time) according to this invariant:


The particulars may change but this formulation describes THE equation that Merton, Black, and Scholes devised to aid investors in making hedged investments using options and other derivatives. The way to read this equation is to note that derivatives will drift or diffuse into the space of the stock price, and proportional to the stock price itself. The drift term occurs due to the interest rate r providing a kind of forcing function. The derivative, V, can also grow due to pure interest rate compounding, as seen in the last term. Whether this actually holds or not, I don't really care as I don't participate in these schemes.

So if you look at it from a very neutral perspective you come up with some interesting observations. For one, you can trivially solve this partial differential equation for a generally disordered set of initial conditions. And the solution appears exactly the same as my first expression above:
V(S,t) = K/S * exp(a*t)

To verify this assertion, we test the expression in the B-S equation, substituting the partial derivatives as we go along.

a*K/S* exp(a*t) + 1/2(σS)2*2*K/S2*exp(a*t) - rS*K/S2*exp(a*t) - r*K/S * exp(a*t) = 0

Cancelling out all common factors:

a/S + 1/2(σS)2*2/S2- rS/S2 - r/S = 0

Reducing the value of S

a/S + 1/2(σ)2*2/S- r/S - r/S = 0

a + 1/2(σ)2*2- r - r = 0

gets us to:

a = 2*r - σ2

The term r is proportional to interest, and σ is volatility or variance in stock price.

So this simple expression that I just cooked up will obey Black-Scholes as long as we choose the constant a term to correspond to the interest and volatility as shown above, and we get:
V(S,t) = K/S * exp((2*r - σ2)*t)

Note that if the volatility (i.e. diffusion) stays high relative to interest, the exponential will damp out with time. If interest (i.e. drift) goes higher than volatility, the exponential will accelerate, creating a huge amount of paper gains.

At this point someone will argue that this solution does not reflect reality. I beg to differ. When you make your bed of mathematical box-springs, you have to lie in it. This solution to Black-Scholes is perfectly fine as it gives a steady-state picture of the partial differential equation. The diffusional and drift components cancel with the right mix of production vs destruction in derivative wealth. If you don't like it, then come up with something different than that specific B-S equation.

I have a feeling that all the seeming complexity of financial quantitative analysis with its Ito calculus and Wiener processes acts as a shiny facade to a simple reality. The math exists to model the inverse relationship of stocks to derivatives. If this didn't happen -- and the lords of high finance absolutely require this relationship to make money -- the math as formulated would vanish from their toolbox. In other words, the math only exists to justify what the financial operatives want to see happen. Everyone appears to implicitly buy this mathematical artifice hook, line, and sinker.

Quantitative analysis and the "quants" who work it have created a fantasy land, where they do not want you to know how easily their quaint ornate universe reduces to a simple function. If they admitted to the charade, the mystery would all disappear and they would no longer have jobs.

Economics and finance does not constitute a science. In science you may need to use partial differential equations. For example, the Fokker-Planck equation shows up quite often -- which incidentally, the Black-Scholes equation shows some similarity to and the quant proponents of B-S certainly like to play up -- but it typically applies to real, physical systems where you use it to try to understand nature, not trying to model some artificial game-like behavior.

I can edit my solution into the Wikipedia page for Black-Scholes and I will bet that someone will immediately remove it. I harbor no illusions. The financial industry depends on the absence of real knowledge to achieve their objectives.

That explains why economics and finance do not classify as sciences; absolute truth does not matter to economists and financiers, only the art of deconstructing profit and the craft of phantom wealth creation does.

Please address editorial comments to: Postings, Main Incinerator, Department of Sanitation, North River Piers, New York, N.Y. 10019.