So to give a hint as to how complete dispersion works, we take an example from a physical process, that of network RTT (round-trip time) dispersion. This figure provides a classic example of packet dispersion, caused by slight differences in transmission rates of messages (taken from SLAC experiments).
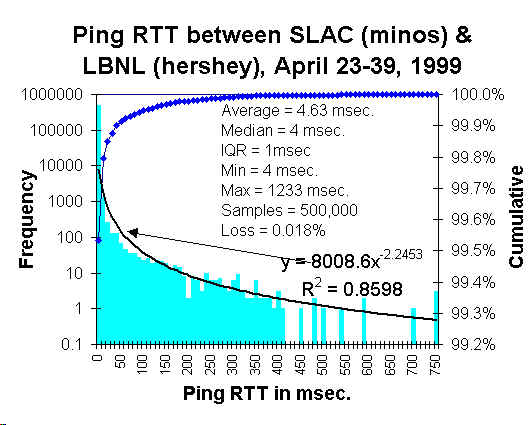
I assumed a simple dispersion of rates, using T=50 microseconds, and determined the following fit:

The equation
T*exp(-T/t)/t/t matches that which I use for the seam or "sweet-spot" variant of the Dispersive Discovery model. Although drawn on a semi-log scale, that shape has much similarity to a shocklet kernel with an immediate production drain on the receiving end. It also illustrates how math that works on a macroscopic scale also often applies to a microscopic scale.I thought I came up with something new here, since the authors of the tutorial chose to use instead a heuristic (of course, similar to what everyone does for oil depletion analysis) but I believe the phenomena has some basis in what researchers refer to as "asymptotic dispersion rate" and "average dispersion rate".
To commemorate yesterday's Black Monday, I dedicate this derivation to everyone who finds it insane that no one can definitely illustrate what kind of mathematical mess that we have gotten the world financial market into. Bunch of flaming idiots.