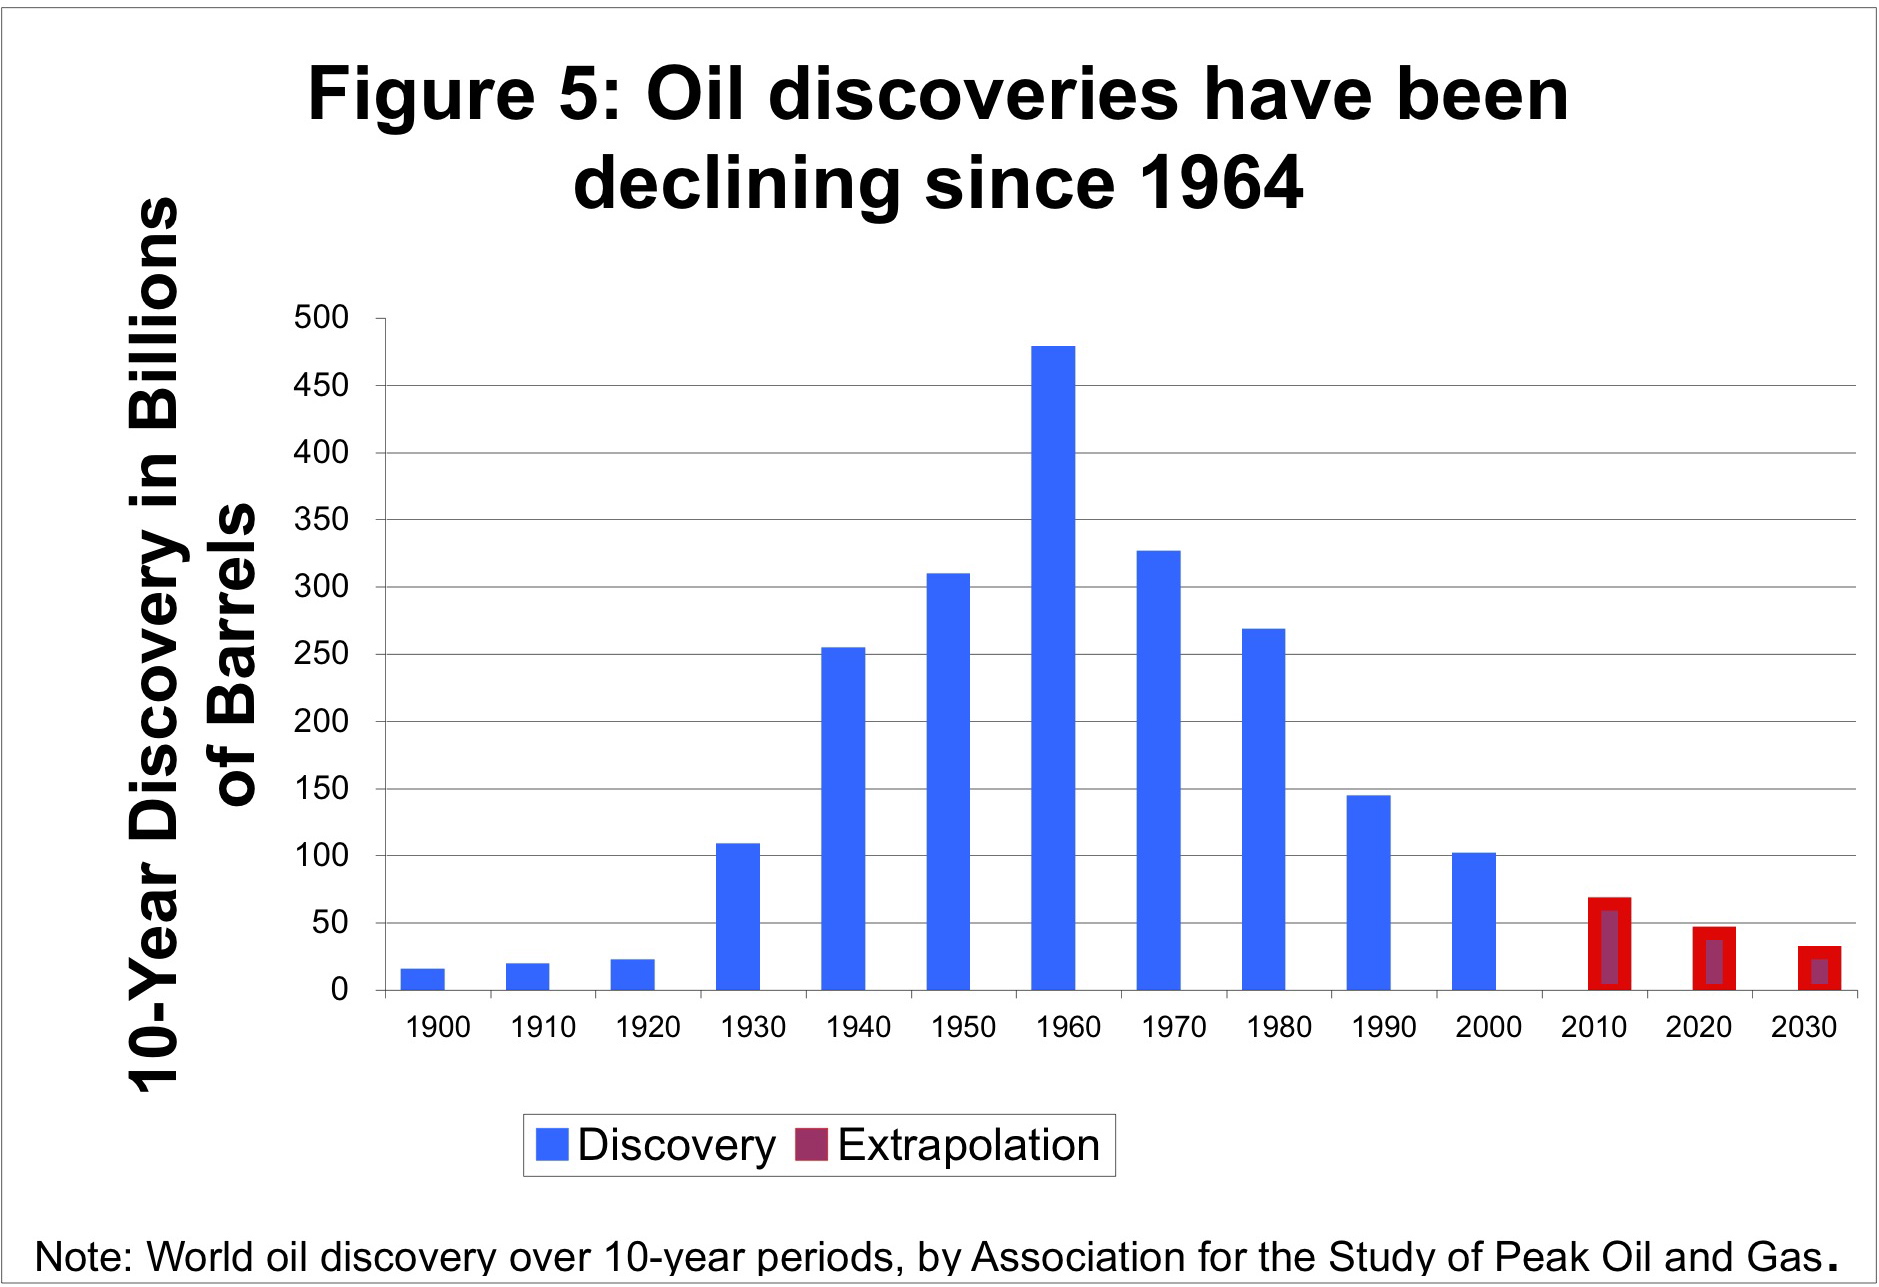
This resurrected from a Rembrandt K post on TOD:

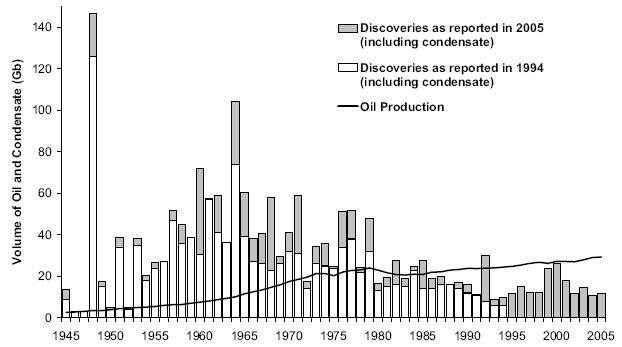
And this from a Khebab post on TOD:
And finally the classic reference profile:


The differences between these curves result primarily from different amounts of filtering. The top one appears to sum up cumulative in each decade, resulting in a more-or-less symmetric bias. However the second has a fairly severe lagged moving average, resulting in the discovery peak shifting right quite a bit. The third shows little by way of filtering and includes superimposed backdating results. The fourth has a 3-year moving average, which I believe came from the unfiltered fifth curve due to Laherrere. I haven't found where I dug up the last curve from.
I figure instead of filtering the data via moving averages, it might make more sense to combine discovery data from different sources and use that as a noise reduction/averaging technique. Ideally I would also like to use a cumulative but that suffers a bit from not having any pre-1900 discovery data.