I constantly read about different estimates for the "CO2 Half-Life" of the atmosphere. I have heard numbers as short as 6 years and others as long as 100 years or more.
ClimateProgress.org -- Strictly speaking, excess atmospheric CO2 does not have a half-life. The distribution has a very long tail, much longer than a decaying exponential. As an approximation, use 300-400 years with about 25% ‘forever’.
....
ClimateProgress.org -- David is correct. Half-life is an inappropriate way to measure CO2 in the atmosphere. The IPCC uses the Bern Carbon Cycle Model. See Chapter 10 of the WG I report (Physical Basis) or http://www.climate.unibe.ch/ ~joos/ OUTGOING/ publications/ hooss01cd.pdf
This issue has importance because CO2 latency and the possible slow retention has grave implications for rebounding from a growing man-made contribution of CO2 to the atmosphere. A typical climate sceptic response will make the claim for a short CO2 lifetime :
Endangerment Finding Proposal
Lastly; numerous measurements of atmospheric CO2 resident lifetime, using many different methods, show that the atmospheric CO2 lifetime is near 5-6 years, not 100 year life as stated by Administrator (FN 18, P 18895), which would be required for anthropogenic CO2 to be accumulated in the earth's atmosphere under the IPCC and CCSP models. Hence, the Administrator is scientifically incorrect replying upon IPCC and CCSP -- the measured lifetimes of atmospheric CO2 prove that the rise in atmospheric CO2 cannot be the unambiguous result of human emissions.
Not knowing a lot about the specific chemistry involved but understanding that CO2 reaction kinetics has much to do with the availability of reactants, I can imagine the number might swing all over the map, particular as a function of altitude. CO2 at higher altitudes would have fewer reactants to interact with.
So what happens if we have a
dispersed rate for the CO2 reaction?
Say the CO2 mean reaction rate is
R=0.1/year (or a 10 year half-life). Since we only know this as a mean, the standard deviation is also 0.1. Placing this in practical mathematical terms, and according to the
Maximum Entropy Principle, the probability density function for a dispersed rate
r is:
p(r) = (1/R) * exp(-r/R)
One can't really argue about this assumption, as it works as a totally unbiased estimator, given that we only know the global mean reaction rate.
So what does the tail of reaction kinetics look like for this dispersed range of half-lifes?
Assuming the individual half-life kinetics act as exponential declines then the dispersed calculation derives as follows
P(t) = integral of p(r)*exp(-rt) over all r
This expression when integrated gives the following simple expression:
P(t) = 1/(1+Rt)
which definitely gives a fat-tail as the following figure shows (note the scale in 100's of years). I can also invoke a more general argument in terms of a mass-action law and drift of materials; this worked well for
oil reservoir sizing. Either way, we get the same characteristic
entroplet shape.
 Figure 1
: Drift (constant rate) Entropic Dispersion
For the plot above, at 500 years, for
R=0.1, about 2% of the original CO2 remains. In comparison for a non-dispersed rate, the amount remaining would drop to exp(-50) or ~
2*10-20 % !
Now say that
R holds at closer to a dispersed mean of 0.01, or a nominal 100 year half-life. Then, the amount left at 500 years sits at 1/(1+0.01*500) = 1/6 ~ 17%.
In comparison, the exponential would drop to exp(-500/100) = 0.0067 ~ 0.7%
Also, 0.7% of the rates will generate a half-life of 20 years or shorter. These particular rates quoted could conceivably result from those volumes of the atmosphere close to the ocean.
Now it gets interesting ...
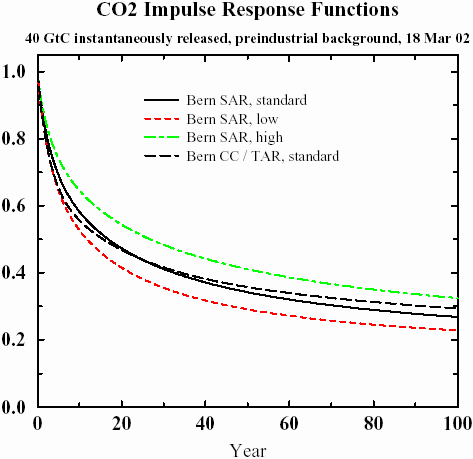
Climatologists refer to the impulse response of the atmosphere to a sudden injection of carbon as a key indicator of climate stability. Having this kind of response data allows one to infer the steady state distribution. The IPCC used this information in their 2007 report.
Current Greenhouse Gas Concentrations
The atmospheric lifetime is used to characterize the decay of an instanenous pulse input to the atmosphere, and can be likened to the time it takes that pulse input to decay to 0.368 (l/e) of its original value. The analogy would be strictly correct if every gas decayed according to a simple expotential curve, which is seldom the case.
...
For CO2 the specification of an atmospheric lifetime is complicated by the numerous removal processes involved, which necessitate complex modeling of the decay curve. Because the decay curve depends on the model used and the assumptions incorporated therein, it is difficult to specify an exact atmospheric lifetime for CO2. Accepted values range around 100 years. Amounts of an instantaneous injection of CO2 remaining after 20, 100, and 500 years, used in the calculation of the GWPs in IPCC (2007), may be calculated from the formula given in footnote a on page 213 of that document. The above-described processes are all accounted for in the derivation of the atmospheric lifetimes in the above table, taken from IPCC (2007).
Click on the following captured screenshot for the explanation of the footnote.

The following graph shows impulse responses from several sets of parameters using the referenced Bern IPCC model (found in
Parameters for tuning a simple carbon cycle model). What I find bizarre about this result is that it shows an asymptotic trend to a constant baseline, and the model parameters reflect this. For a system at equilibrium, the impulse response decay should go to zero. I believe that it physically does, but that this model completely misses the fact that it eventually should decay completely. In any case, the tail shows huge amount of "fatness", easily stretching beyond 100 years, and something else must explain this fact.
 Figure 2
: IPCC Model for Impulse Response
If you think of what happens in the atmosphere, the migration of CO2 from low-reaction rate regions to high-reaction rate regions can only occur via the process of diffusion. We can write a
simple relationship for Fick's Law diffusion as follows:
dG(t)/dt = D (C(0)-C(x))/G(t)

This states that the growth rate d
G(
t)/d
t remains proportional to the gradient in concentration it faces. As a volume gets swept clean of reactants,
G(
t) gets larger and it takes progressively longer for the material to "diffuse" to the side where it can react. This basically describes
oxide growth as well.
The outcome of Fick's Law generates a growth law that goes as the square root of time -
t 1/2. According to the dispersion formulation for cumulative growth, we simply have to replace the previous linear drift growth rate shown in
Figure 1 with the diffusion-limited growth rate.
P(t) = 1/(1+R*t 1/2)
or in an alternate form where we replace the probability
P(
t) with a normalized response function
R(
t):
R(t) = a/(a+t 1/2)
At small time scales, diffusion can show an infinite growth slope, so using a finite width unit pulse instead of a delta impulse will create a reasonable picture of the dispersion/diffusion dynamics.
Remarkably, this simple model reproduces the IPCC-SAR model almost exactly, with the appropriate choice of
a and a unit pulse input of 2 years. The IPCC-TAR fit uses a delta impulse function. The analytically calculated points lie right on top of the lines of
Figure 2, which actually makes it hard to see the excellent agreement. The window of low to high reaction rates generates a range of
a from 1.75 to 3.4, or approximately a 50% variation about the nominal. I find it very useful that the model essentially boils down to a single parameter of entropic rate origin (while both diffusion and dispersion generates the shape) .
 Figure 3
: Entropic Dispersion with diffusional growth kinetics describes the CO2 impulse response function with a
single parameter
a. The square of this number describes a characteristic time for the CO2 concentration lifetime.
You don't see it on this scale, but the tail will eventually reach zero, but at a rate asympotically proportional to the square root of time. In 10,000 years, it will reach approximately the 2% level (i.e. 2/sqrt(10000)).
Two other interesting observations grow out of this most parsimonious agreement.
First of all, why did the original IPCC modelers from Bern not use an expression as simple as the entropic dispersion formulation? Instead of using a three-line derivation with a resultant single parameter to model with, they chose an empirical set of 5 exponential functions with a total of 10 parameters and then a baseline offset. That makes no sense unless their model essentially grows out of some heuristic fit to measurements from a real-life carbon impulse (perhaps data from paleoclimatology investigation of an ancient volcanic eruption; I haven't tracked this down yet). I can only infer that they never made the connection to the real statistical physics.
Secondly, the simple model really helps explain the huge discrepancy between the quoted short lifetimes by climate sceptics and the long lifetimes stated by the climate scientists. These differ by more than a magnitude. Yet, just by looking at the impulse response in
Figure 3, you can see the fast decline that takes place in less than a decade and distinguish this from the longer decline that occurs over the course of a century. This results as a consequence of the entropy within the atmosphere, leading to a large dispersion in reaction rates, and the rates limited by diffusion kinetics as the CO2 migrates to conducive volumes. The fast slope evolving gradually into a slow slope has all the characteristics of the "law of diminishing returns" characteristic of diffusion, with the precise fit occurring because I included dispersion correctly and according to maximum entropy principles. (Note that I just finished a post on
cloud ice crystal formation kinetics which show this same parsimonious agreement).
Think of it this way: if this simple model didn't work, one would have to reason why it failed. I contend that entropy and disorder in physically processes plays such a large role that it ends up controlling a
host of observations. Unfortunately, most scientists
don't think in these terms; they still routinely rely on deterministic arguments alone. Which gets them in the habit of using heuristics instead of the logically appropriate stochastic solution.
Which leads me to realize that the first two observations have the unfortunate effect of complicating the climate change discussion.
I don't really know, but might not climate change deniers twist facts that have just a kernel of truth? Yes, "some" of the CO2 concentrations may have a half-life of 10 years, but that misses the point completely that variations can and do occur. I am almost certain that sceptics that hang around at sites like ClimateAudit.org see that initial steep slope on the impulse response and convince themselves that a 10 year half-life must happen, and then decide to use that to challenge climate change science. Heuristics give the skilled debater ammo to argue their point any way they want.
I can imagine that just having the ability to argue in the context of a simple entropic disorder can only help the discussion along, and relying on a few logically sound first-principles models provides great counter-ammo against the sceptics.
One more thing ...So we see how a huge fat tail can occur in the CO2 impulse response. What kind of implication does this have for the long term?
Disconcerting, and that brings us to the point that the point that climate scientists have made all along. With a fat-tail, one can demonstrate that a CO2 latency fat-tail will cause the responses to forcing functions to continue to get worse over time.
As
this paper notes and I have modeled, applying a stimulus generates a non-linear impulse response which will look close to
Figure 3. Not surprisingly but still quite disturbing, applying multiple forcing functions as a function of time will not allow the tails to damp out quickly enough, and the tails will gradually accumulate to a larger and larger fraction of the total. Mathematically you can work this out as a convolution and use some neat techniques in terms of Laplace or
Fourier transforms to prove this analytically or numerically.
This essentially explains the 25% forever in the ClimateProgress comment. Dispersion of rates essentially prohibit the concentrations to reach a comfortable equilibrium. The man-made forcing functions keep coming and we have no outlet to let it dissipate quickly enough.
I realize that we also need to consider the CO2 saturation level in the atmosphere. We may asymptotically reach this level and therefore stifle the forcing function build-up, but I imagine that no one really knows how this could play out.
As to one remaining question, do we believe that this dispersion actually exists? Applying Bayes Theorem to the uncertainty in the numbers that people have given, I would think it likely. Uncertainty in people's opinions usually results in uncertainty (i.e. dispersion) in reality.
This paper addresses many of the uncertainties underlying climate change:
The shape of things to come: why is climate change so predictable?The framework of feedback analysis is used to explore the controls on the shape of the probability distribution of global mean surface temperature response to climate forcing. It is shown that ocean heat uptake, which delays and damps the temperature rise, can be represented as a transient negative feedback. This transient negative feedback causes the transient climate change to have a narrower probability distribution than that of the equilibrium climate response (the climate sensitivity). In this sense, climate change is much more predictable than climate sensitivity. The width of the distribution grows gradually over time, a consequence of which is that the larger the climate change being contemplated, the greater the uncertainty is about when that change will be realized. Another consequence of this slow growth is that further eff orts to constrain climate sensitivity will be of very limited value for climate projections on societally-relevant time scales. Finally, it is demonstrated that the e ffect on climate predictability of reducing uncertainty in the atmospheric feedbacks is greater than the eff ect of reducing uncertainty in ocean feedbacks by the same proportion. However, at least at the global scale, the total impact of uncertainty in climate feedbacks is dwarfed by the impact of uncertainty in climate forcing, which in turn is contingent on choices made about future anthropogenic emissions.
In some sense, the fat-tails may work to increase our certainty in the eventual effects -- we only have uncertainty in the
when it will occur. People always think that fat-tails only expose the rare events. In this case, they can reveal the inevitable.
Added Info:Segalstad
pulled together all the experimentally estimated
residence times for CO2 that he could find, and I reproduced them below. By collecting the statistics for the equivalent rates, it turns out that the standard deviation approximately equals the mean (0.17/year) -- this supports the idea that the uncertainty in rates found by measurement matches the uncertainty found in nature, thus giving the entropic fat tail. These still don't appear to consider diffusion, which fattens the tail even more.
| Authors [publication year] | Residence time (years) |
| Based on natural carbon-14 |
|
Craig [1957]
| 7 +/- 3 |
| Revelle & Suess [1957] | 7 |
| Arnold & Anderson [1957]including living and dead biosphere | 10 |
| (Siegenthaler,1989) |
4-9 |
| Craig [1958] | 7 +/- 5 |
| Bolin & Eriksson [1959] | 5 |
| Broecker [1963], recalc. by Broecker & Peng [1974] | 8 |
| Craig [1963] | 5-15 |
| Keeling [1973b] | 7 |
| Broecker [1974] | 9.2 |
| Oeschger et al. [1975] | 6-9 |
| Keeling [1979] | 7.53 |
| Peng et al. [1979] | 7.6 (5.5-9.4)
|
| Siegenthaler et al. [1980] | 7.5 |
| Lal & Suess [1983] | 3-25 |
| Siegenthaler [1983] | 7.9-10.6 |
| Kratz et al. [1983] | 6.7 |
| Based on Suess Effect |
|
| Ferguson [1958] | 2 (1-8) |
| Bacastow & Keeling [1973] | 6.3-7.0 |
| Based on bomb carbon-14 |
|
| Bien & Suess [1967] | >10 |
| Münnich & Roether [1967] | 5.4 |
| Nydal [1968] | 5-10 |
| Young & Fairhall [1968] | 4-6 |
| Rafter & O'Brian [1970] | 12 |
| Machta (1972) | 2 |
| Broecker et al. [1980a] | 6.2-8.8 |
| Stuiver [1980] | 6.8 |
| Quay & Stuiver [1980] | 7.5 |
| Delibrias [1980] | 6 |
| Druffel & Suess [1983] | 12.5 |
| Siegenthaler [1983] | 6.99-7.54 |
| Based on radon-222 |
|
| Broecker & Peng [1974] | 8 |
| Peng et al. [1979] | 7.8-13.2 |
| Peng et al. [1983] | 8.4 |
| Based on solubility data |
|
| Murray< (1992) | 5.4 |
| Based on carbon-13/carbon-12 mass balance |
|
| Segalstad (1992) | 5.4 |

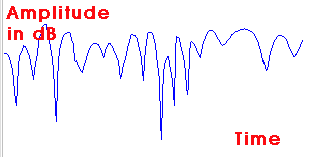
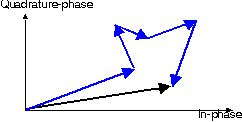
 tronics flip the phase so all interferences turn destructive, but for wireless devices, the interferences turn random, some positive and some negative, so the result gives the random signal shown.
 Yet since power (E) is proportional to Amplitude squared (r 2), we can derive the probability density function by invoking the chain rule.


